Saratoga County’s median home sale price reached $485,000 in September, up from $445,000 a year earlier. Pending listings moved the other way, falling from 235 to 205.
Those figures come from a Global MLS residential report compiled October 9. Closed sales changed little: 233 homes sold in September, compared with 238 in September 2025. The report counted 590 active listings, down from 612.
The median was up about 9%, but the homes making up that median also changed. Nearly half of September’s sales were at $500,000 or more: 113 of 233, or 48.5%. A year earlier, that price range accounted for 91 of 238 sales, or 38.2%.
What the $485,000 median tells us
A median is the middle sale price in the group. This September, higher-priced homes made up a larger share of the sales. The report does not tell us how much that shift contributed to the increase, and it does not establish that every home gained 9% in value.
For an owner considering a fall sale, the useful comparison is closer to home. Look for recent sales in the same area with similar lot sizes, living space and condition. A renovated kitchen or a roof nearing replacement deserves more attention in that comparison than the countywide percentage.
Fewer pending listings, with a small change in selling time
The pending count was down 12.8% from a year earlier. Average days on market rose from 22 to 27, while the median moved from eight days to nine. That gap between the average and median is a reason to look at individual listings before deciding how much time to allow for a sale.
Review the homes that sold quickly as well as those still available. How did they compare on price, condition and location? A recently sold home helps support an asking price; an active listing shows what a buyer could tour alongside yours this weekend.
September’s numbers give sellers a useful starting point for that review. Before settling on a price, check the current listings and recent sales that most closely match your property.
About the numbers
Source: Global MLS / Flexmls, custom Market Summary compiled October 9, 2026, for Saratoga County residential properties in September 2026. Comparisons are with September 2025. “Include Comp Sale Listings” was unchecked; price-band shares were calculated from the report’s sales counts. MLS data may be revised.
This member-access report is separate from GCAR’s public monthly release. Figures cover the county, not just the City of Saratoga Springs, and September’s active count is not today’s available inventory.
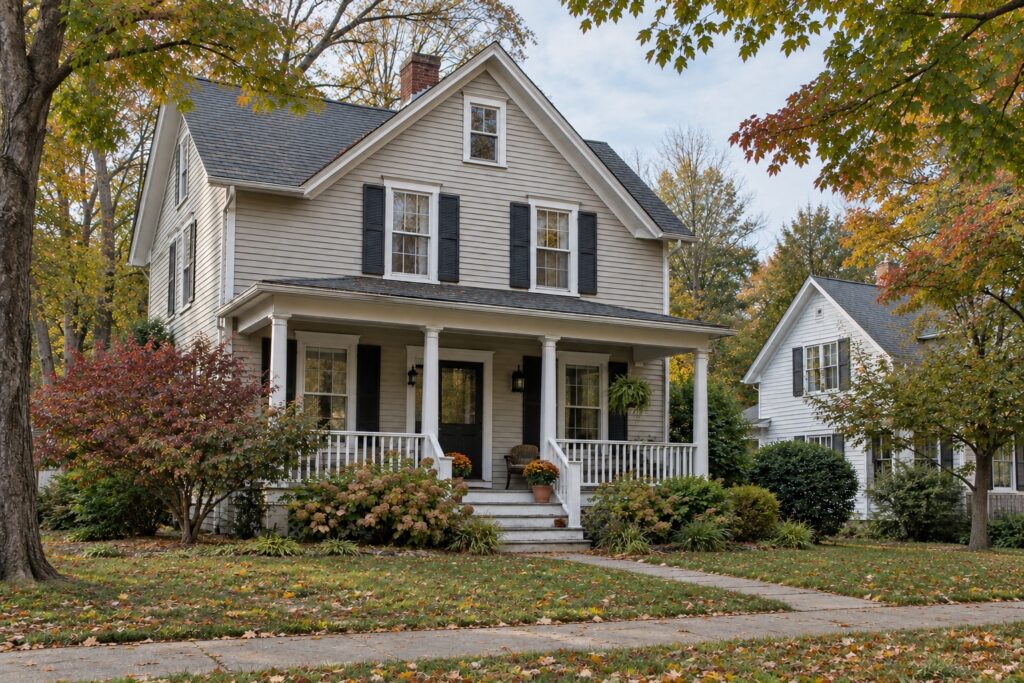
Image: AI-generated editorial illustration of an imagined upstate New York neighborhood; not a property listing.